Technology
Work and personal projects using Python, SQL, Power BI and Tableau.
EDA with Python (link)
Analysing Top 1000 Grossing Hollywood Movies
Categorical Analysis with Seaborn and Matplotlib
Distributor count, distributor revenue sum, license sum and revenue sum, genre count
Correlation
Correlation matrix, regression plots between world sales, local sales and international sales.

Visualizing Consumer Data with Tableau (link)

Visualised consumer insights on wellbeing and lifestyle of global participants by gender and age
Overview
- Female has slightly more participants with excellent or good lifestyle balance score than male (40.66% vs 37.44%)
- Participants aged 51 or more has the highest portion of excellent or good lifestyle balance holder whilst participants aged less than 20 has the lowest.
Details
- healthy body: male less than 20 takes progressively more steps throughout the years while noticeably less sleep in 2021 than their female counterparts among all age clusters.
- healthy mind: male aged between 21 to 50 used meditation as a mean to embrace positive emotions much more than their female counterparts. Male less than 20 has a noticeable surge in going with the flow in 2021.
- expertise: female less than 20 caught up on time for passion and led the way for achieving personal rewards in 2021 than its male counterparts
- meaning: female across all age clusters have been consistently high up on donation and supporting others parameters
Automated Customer Product Spend Dashboard with Power BI (link)

Overview
This dashboard provides senior management one-stop access to LTD and rolling 12 months data points on key customer, product and spend data points. All data visualizations are dynamically built, meaning latest data can always be loaded correctly with the refresh button.
Highlight
- Product: product category utilization rate, top 10 P&S by total active customer count vs growth count
- Customer: customer retention rate, counting customers by multiple participation definitions
- Spend: actual vs forecast/budget, ability to drill down to sub sectors and seasonality
note: actual data is hidden due to confidentiality of data

Overview
Both dashboards are automated for tracking customer activities.
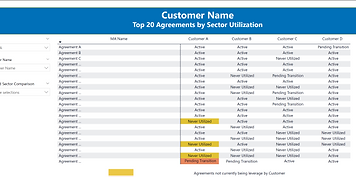
Customer Snapshot is a client-facing dashboard that aids in conducting regular business review to showcase company's value add to the customers and spark conversations to deepen the collaboration.
Customer Transition Tracker provides a quick summary of project transition health and guidance to multiple teams on which project to prioritize to transition customers.
All data visualizations are dynamically built, meaning latest data can always be loaded correctly with the refresh button.
Highlight
- Customer Snapshot: Highlight spend with missing contract, compare customers with other customers of interest in the same sector
- Customer Transition Tracker: customer transition %, % by sub sector and progress bar, comparing unique customers in old and new generation with two simple visuals
note: actual data is hidden due to confidentiality of data
SQL data cleaning (link)
with Postgresql
- Standardise data format
- Populate property address data
- Break out address into address, city, state
- Standardise boolean data format
- Remove duplicates using CTE

Exploring COVID travel data (link)
with sqlite3
Analysing US travel pattern before and during the year after US government declared COVID a public health emergency
Objective
if there was significant difference in travel pattern of different US states in 2019 and 2020
Parameters
- ratio of short versus medium versus long trips
- top states with highest number of trips YoY
- number of people staying at home versus out
Further data analysis could be performed cross referencing COVID-19 news such as timeline of state government pandemic measures and can be used to study their effectiveness and American's attitude towards COVID-19 and travel.

Visualizing automaker businessdata (link)
with Power BI
Overview
- Sales and number of orders grew steadily MoM, QoQ, YoY.
- Order status is healthy with >92% order shipped
- The company is relying heavily on singular country (USA), product line (classic cars), clients (Euro Channel) to deliver performance
Region
- EMEA and NA have rather positive net customer growth in quarter 1, 3, 4 YoY. APAC and Japan perform flat. Quarter 2 shows the weakest growth
Product
- In line with overall sales, Classic car brings the highest AOV, followed by ships and motorcycles.
- All product lines grew from 2003 to 2004
- >50% of problematic orders are cancelled or on hold. The most cancelled product line is ships.
Customer
- Similar to overall performance, 2 clients (Euro Shopping Channel and Mini Gift Distribution Ltd.) account for >50% of revenue among its top 10 clients, with both clients order fluctuating QoQ in the last 3 years
